Key Takeaways
- Animated infographics transform hard-to-understand data into engaging visual stories people remember
- Infographic animation services help businesses communicate statistics, trends, and insights clearly
- Animated data visualization works better than static charts for audience engagement and retention
- Infographic videos are perfect for presentations, marketing, and internal communication
- Professional infographic design combined with animation increases message impact significantly
- Animated business infographics drive better decision-making through clearer information presentation
Data abounds in business. You have sales figures. Data about your customers. Information about market trends. Performance indicators. Graphs about company growth. While data is not an issue, understanding data is a challenge. Boring figures in spreadsheets don't work. People find tables and charts perplexing. Percentages do not stick in mind. You need a better way to communicate what the data means, and that is where animated infographics come in.
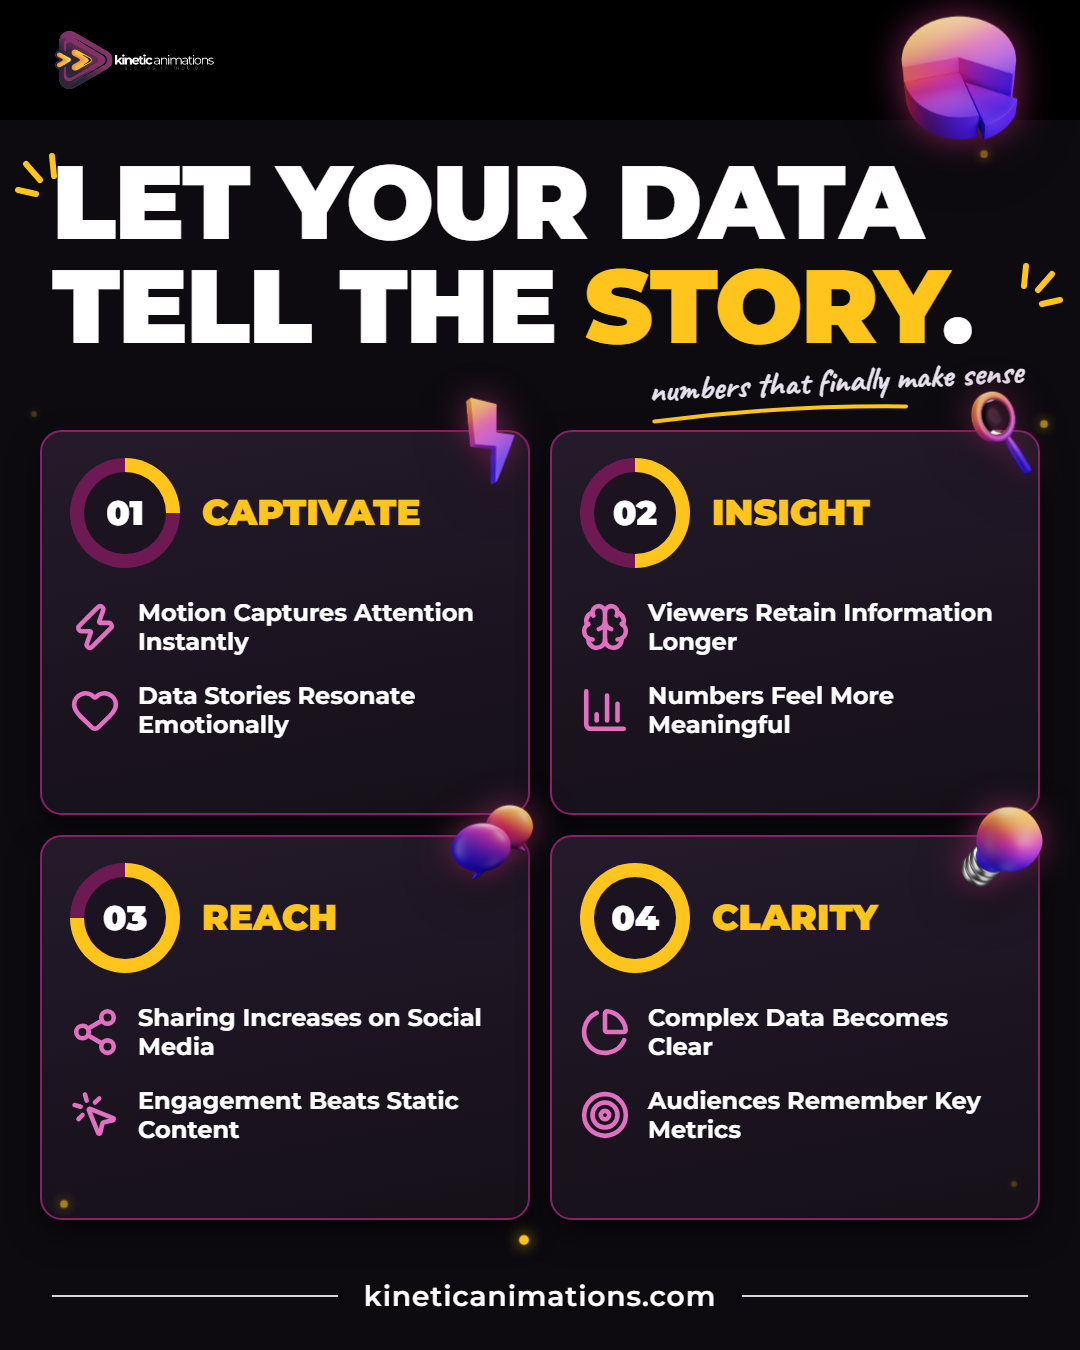
Unlike raw numbers, animated infographics tell stories with data. Numbers rise up to depict growth. Pie charts build their structure. Trends are visualized. Now, your audience understands your data right away and remembers it for a long time. This effect is achieved through the skilful use of motion, colors, and timing.
This guide will take a look at the ways animated infographics make the process of communicating complex information easier, their advantages over static alternatives, and the ways your company may take advantage of infographic animation services to communicate data effectively. Let's discuss the importance of animated data visualization.
The Reality of Presenting Complex Data Without Animation
People find it hard to understand raw figures. If you say that quarterly profits are up by 23 percent, they lose interest. If you explain that there is an increase in the number of customers from 150 to 400 per month, the figures become confusing. There is no emotional connection between people and statistics. Figures seem impersonal and abstract.
Static infographics, which are printed or used as static images, do not solve the problem properly. They are better than spreadsheets, but viewers still have to work to get the information. People need to analyze and draw conclusions for themselves. Such an activity is mentally exhausting and causes people to lose interest in understanding the information.
It all brings real negative effects for your company. Key metrics are misunderstood by decision-makers. Marketing teams cannot develop the narrative based on the figures. Presentations of salespeople do not attract clients. Everyone within the company does not understand the point of your strategy. The figures exist; you just communicate them poorly.
How Animated Infographics Transform Data Communication
Movement Captures Attention Automatically
The brain is programmed to focus on movement. Once a graphic starts animating itself, people tend to observe naturally. Colors change. Figures add up. Lines trace themselves. Bars change sizes. Movement attracts the attention of viewers automatically, making no need for any effort.
Animated infographics exploit this psychological aspect of visual perception. In contrast to regular infographics that demand analysis by viewers, animated infographics provide information through its movement. Passive observation appears to be less tiring than processing of the information provided by static infographics.
Storytelling Makes Data Meaningful
Raw numbers lack context. But animated data visualization places numbers within stories. You use animation to illustrate how the number of customer complaints fell by 40% over the past year. You have used animation to visualize how the marketing expenditure translates into revenue in an effort to illustrate the connection.
Storytelling, in effect, makes abstract facts come alive to your audience in a narrative that is relevant. The infographics are animated so that people not only see the facts, but also understand why they matter.
Why Animated Infographics Outperform Static Alternatives
Animated data visualization reveals information one step at a time, so viewers are not hit with every number at once. That makes it easier to see how pieces of data connect and to remember the key figures afterwards, especially when a voiceover explains what each number means.
You can see the difference in your own engagement metrics. Compare shares and watch time for an infographic video against a static graphic on social media, or audience attention in presentations that use animated business infographics. Track these numbers so you know what works for your audience.
The value of professional infographic design is increased even further with animation. Colors that look good on static infographic designs look even better in motion. Designs that may look overloaded on static images look vibrant on animated infographics.
Different Ways Animated Infographics Work Across Business Types
Financial services firms utilize animated infographics to provide information on how their investments are performing, what is happening in the markets, and what is changing in the portfolio. Abstract numbers are brought to life through animated data visualization. Animated infographics help clients to better understand how their investments are performing.
Software-as-a-service (SaaS) companies utilize animated business infographics to showcase product statistics, customer success stories, and growth trajectories. Animated infographics help prove growth to investors and communicate value to customers.
Healthcare organizations utilize animated infographics to demonstrate statistics about diseases, the efficacy of treatments, and outcomes of patients. Medical data is made understandable for patients through well-thought-out data visualization animation. In educational presentations, there are examples of animated infographics that visualize data in an entertaining way.
E-commerce companies utilize infographic videos that illustrate sales data, customers' preferences, and inventory management. On social media, animated business infographics tend to stand out in the feed more than static charts.
Creating Animated Infographics That Actually Work
Begin with selecting data to animate. Not all statistics require animation. Select statistics that narrate stories. Determine what the main point you would like to convey is. Create the entire infographic on the basis of this core idea without trying to incorporate all aspects.
Keep your animated infographics simple. Excessive data will confuse the viewer even in animated videos. Limit the number of data points to just three to five points per each infographic video. Let each data point settle before presenting the next one.
Select your colors carefully in case of animated business infographics. Colors should emphasize important information without distracting viewers. Using uniform color schemes in infographic animation services will create brand identity. Test whether your animated data visualization still works in black and white; if it does, your design is strong enough to work in color.
Infographic Videos in Your Marketing and Communication Strategy
Where Animated Infographics Belong in Your Mix
Animated infographics work perfectly for social media content. People scroll through feeds quickly, but animation stops the scroll. Infographic videos capture the viewer’s attention while delivering information and allowing him/her to move ahead. Sharing animated infographics regularly can grow your audience and your reputation as an expert.
A landing page which incorporates content related to infographic animation service works much better. Infographic animations on case studies of your business will make the page more interesting. Your about page can make a lot more sense with the help of animated infographics demonstrating your company's growth.
Animated infographics can also lift email marketing. Most inboxes do not play video, so use a short animated GIF or a thumbnail that links to the full video. A clear visual of your key numbers is quicker to take in than a text-heavy email, and it gives subscribers a reason to click. Marketing automation campaigns benefit when professional infographic design is used strategically.
Common Mistakes People Make with Animated Infographics
Attempts to communicate an abundance of information in one go will make animated infographics ineffective. The inclusion of numerous statistics in one infographic video will only overwhelm the viewer. Viewers will be left feeling puzzled instead of enlightened by animated data visualization.
Bad pacing makes animated infographics ineffective. Data that is communicated too fast overwhelms viewers. Data that is communicated too slowly will make the viewer feel frustrated. Animation of infographic should maintain the right pace such that information is communicated to the viewer without frustrating him.
There are cases when there is a mismatch between visuals and data in animated business infographics. Colors that do not correlate with the data confuse viewers rather than enlightening them. Professional infographic design considers how every visual element serves your core message.
Ignoring your audience when creating animated infographics misses the mark entirely. Data important to investors differs from data important to customers. Animated data visualization should speak to your specific audience with language and examples they understand.
Getting Started with Animated Infographics for Your Business
Get started with one animated infographic video, and use the most important metrics/achievements of your business there. Try out what works by using this first video and collecting feedback from your team and audience. See what is appreciated before proceeding with the development of animated infographics.
Know what message you have to deliver before using the help of infographic animation services. What one thing should people learn from watching an animated data visualization? That one thing is the main point of everything else.
Think about the places for your animated infographics. Where will your infographic videos be available? How will people find them? Some platforms are better for some types of infographic videos than others. Social media likes shorter animations. Website pages can support longer animated data visualization. Email works best with compact animations.
Kinetic Animations Animated Infographics Services
Once you are ready to convert your data into stunning visuals, infographic animation services from expert providers can prove immensely useful. Kinetic Animations is an expert provider of animated infographics that clearly convey the data. We know how to create animated data visualization that fulfills your business objectives.
We craft animated infographics for you that capture the attention of your audiences and facilitate their understanding of the matter at hand. Animated infographics work across industries such as finance, SaaS, healthcare and e-commerce. Every infographic video produced by us serves your particular communication purposes and targets the relevant audience.
We emphasize clarity and impact in all animated infographics created by us. We ask the right questions pertaining to your data and the intended audience. We recommend the optimal complexity of your animated data visualization projects. We deliver professional infographic design that turns data into understanding.
Conclusion
Animated infographics transform how businesses communicate data. Animated data visualization makes complex information easily understandable. The audience grasps information more quickly and retains the knowledge longer. Sharing information becomes more common too. Our infographic animation services will provide tangible advantages for you apart from good looks only.
Animated infographics are useful whenever you want to show quarterly figures, highlight success of your customers, analyze current market trends, convince investors of your reliability or perform any other activity where visualization of your data will play a key role.
The question here is not if but when you will use animated infographics for business. Let us know and we will explain what kind of benefits our animated data visualization will bring for your business needs. Our infographic animation services turn your numbers into stories that resonate, inform, and inspire action.